
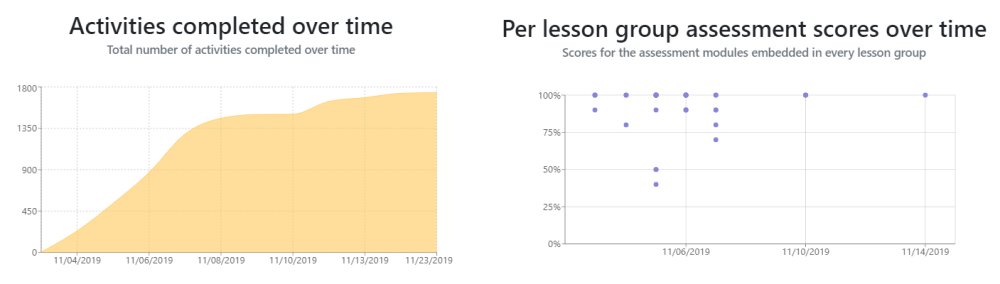
A key advantage of digital learning is that we can use the data collected during the process of learning, not just to drive personalized adaptation of the learning content presented to the child in a given moment, but also to derive learning analytics for individuals and groups that can be used for longer-term understanding and adaptation. We are pleased to say that we have taken an important first step towards the development of a comprehensive learning analytics framework. In parallel with the IVYP pilot deployment in Goleta, California, we have launched a learner metrics dashboard in order to help us, and our partners, develop a feel for learner engagement and progress with our GLEN Learn app. The dashboard provides a visualization of learner metrics collected by the GLEN Learn app at both the individual and cohort level for a given deployment. We believe that such visualization provides powerful insight into the different ways children are interacting with our content, and into how learning outcomes evolve over time and across learners. We are hopeful that such insights on how the GLEN Learn app is being used “in the wild” will help us continually identify avenues for improvement.
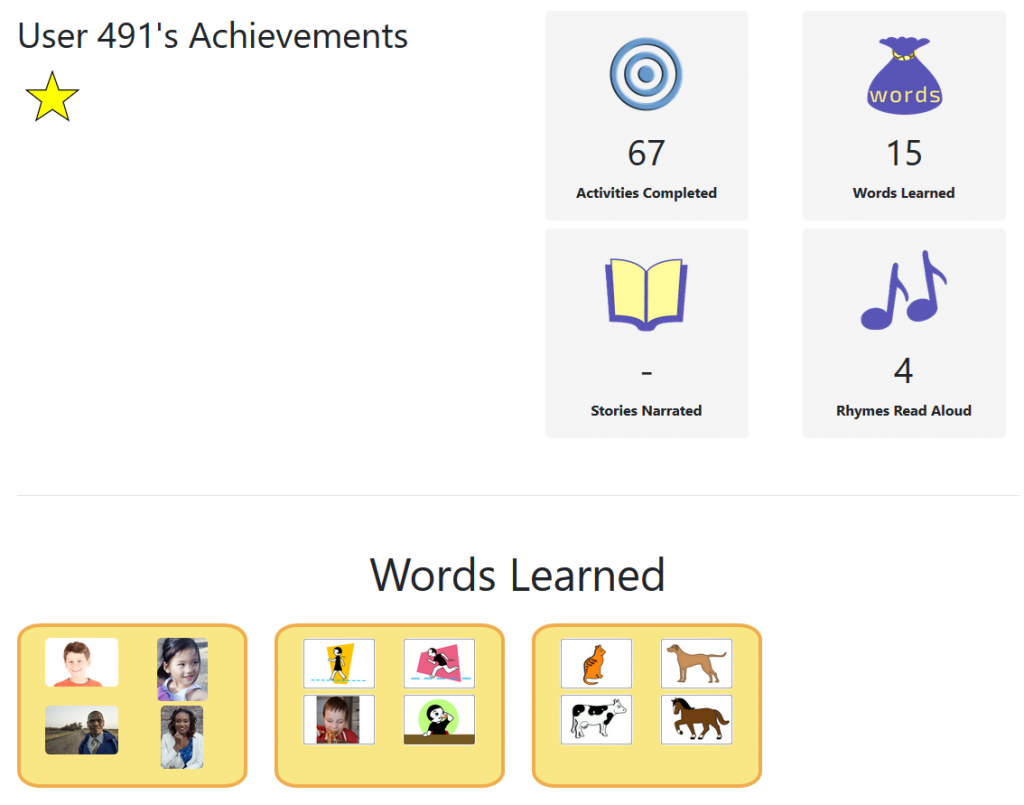
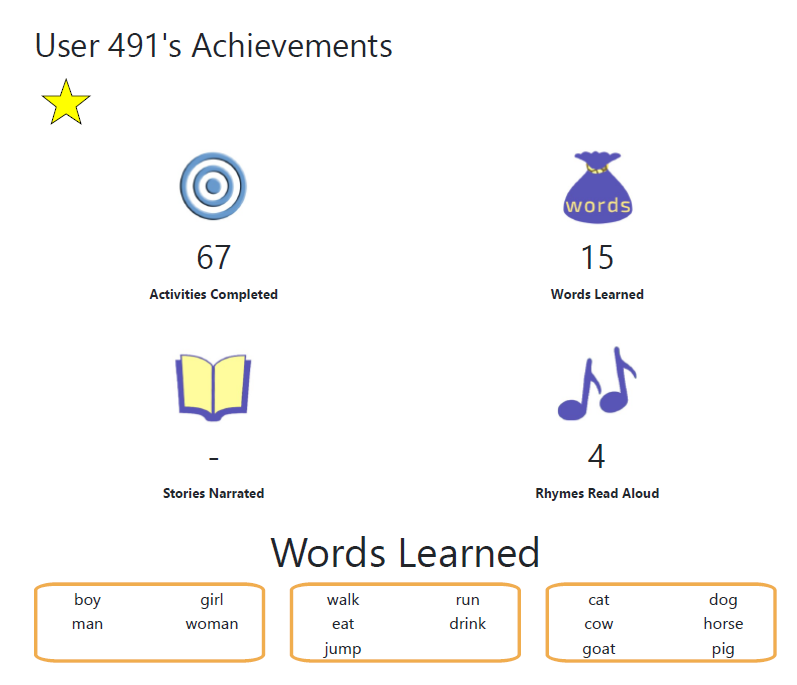
Pictures speak louder than words, so here are a few snapshots of cohort- and user-level metrics from the dashboard for a test deployment. Notice that the user names are anonymized. We plan to use the data from each deployment, and across deployments, in our collaborations with education and language acquisition researchers, hence the data must of course be anonymized. For a given deployment, the “real” user names are created by, and available to, authorized teachers and administrators.
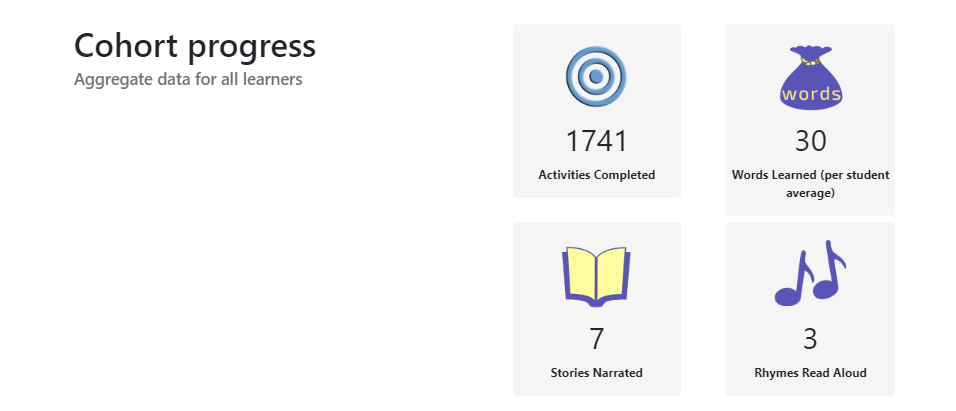
In addition to helping us assess and improve our learning content, the dashboard is a valuable tool for our partner organizations. It provides teachers with a way to monitor the progress of every child, in order to make adjustments in the classroom as needed, and to identify students who might need additional support. It provides administrators with a bird’s eye view of the learner progress in each classroom, and will hopefully help them better support teachers and students.
We are committed to continually evolving the dashboard with inputs from our deployment partners and research collaborators. A great example of this is a feature that we added at the suggestion of our partners at IVYP: for each child, key metrics from the dashboard can be printed out at any time as a certificate of learning achievement (see below) that can be sent home with the child. For young English learners, this is a particularly important tool for engaging their families in supporting their learning efforts.
We view this dashboard, and the associated data collection framework, as a crucial step in our journey. We expect that it will provide a nuanced picture in terms of the needs of our learners and the impact of our learning content over time, in addition to fine-grained measurements of learning outcomes. This information, coupled with the critical qualitative feedback from our deployment partners, will help us continually improve the ways in which we work with young English learners and the institutions that support them.